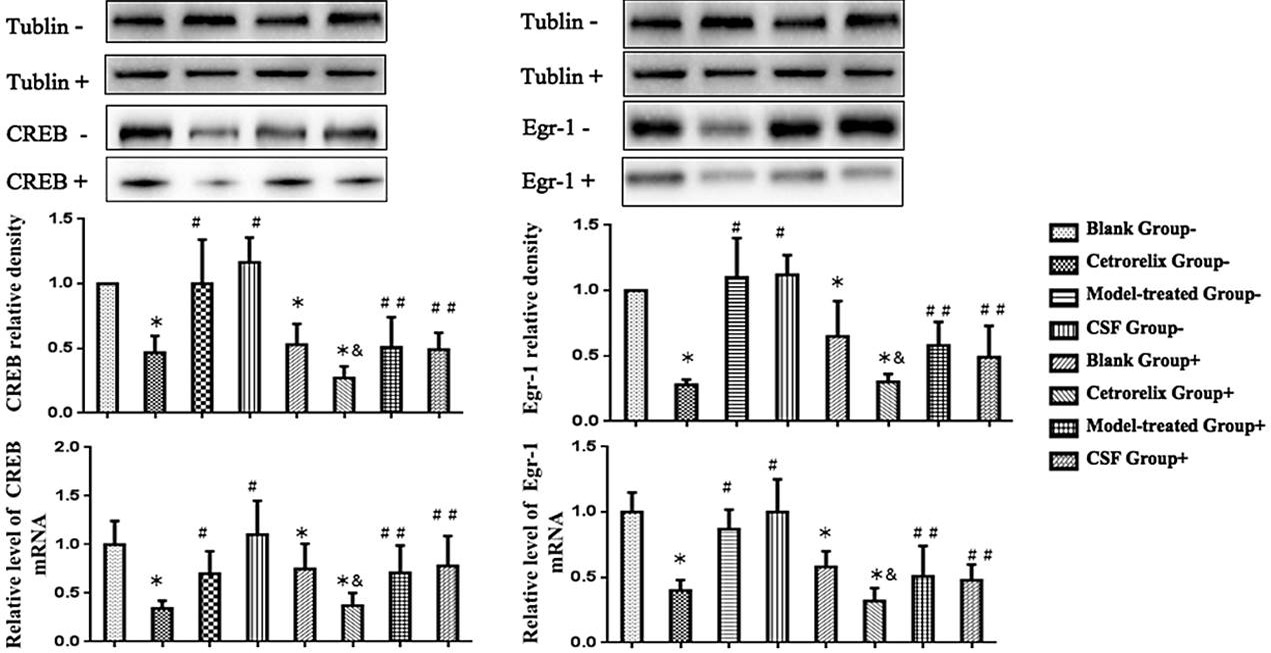
Fig. 3.
Comparison of mRNA and protein levels of CREB and Egr-1 in RPC cells. *p<0.05 compared to the blank(-) group, #p<0.05, *p>0.05 compared to the Cetrorelix (-) group. &p<0.05 compared to the blank(+) group,##p>0.05 compared to the Cetrorelix (+) group.